Budburst – Lilac Festival
About this Inquiry
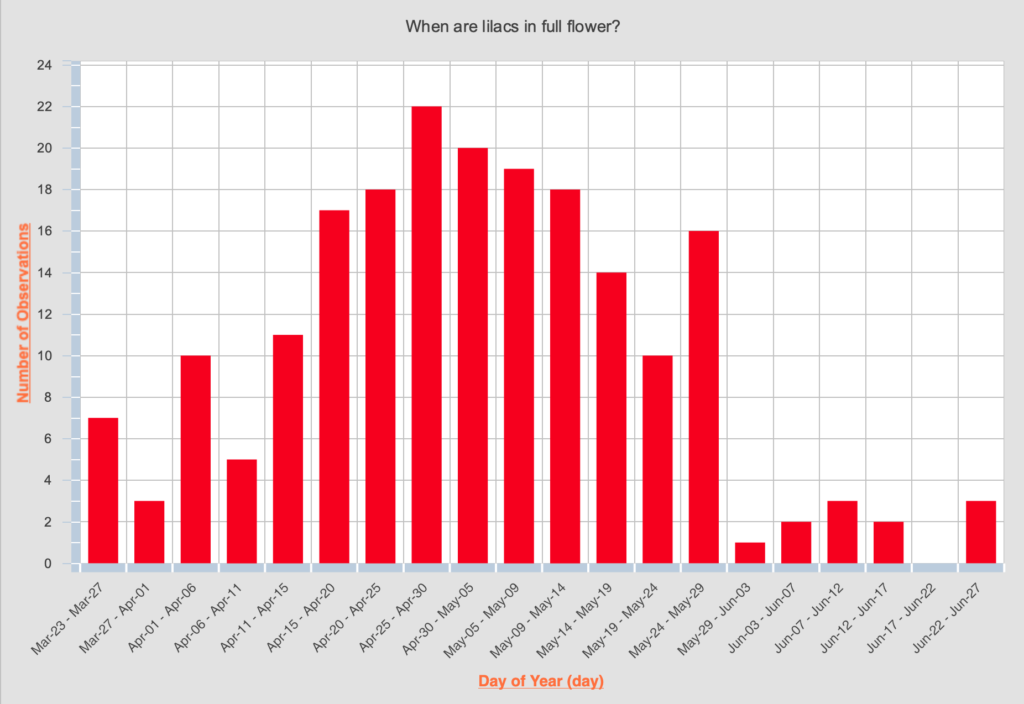
In this Inquiry, students predict the best date to host a lilac blossom festival so that lilacs are in full bloom in the city where students live. Students are introduced to Project Budburst, a citizen science project in which volunteers monitor the timing of plant life cycle events. Students examine a histogram in FieldScope showing when lilacs are in full flower around the country and discover a large amount of variability. They then discuss factors that affect the timing of plant flowering and decide to look at the relationship between latitude (as a proxy for day length and temperature) and timing of full flower. They examine a scatter plot with a best-fit line in FieldScope. Students identify the latitude of their city and use the best-fit line to calculate a predicted date to host the lilac festival. Finally, they evaluate their level of certainty about the date predicted by the best-fit line and discuss other factors that might contribute to variability in the date of full flower where they live.
Instructional Days
3 days
Learning Goals
- Analyze data using tools and mathematical models to make claims about when lilacs will be in full bloom in their area.
- Apply concepts of statistics and probability (including determining function fits to data, slope, intercept, and correlation coefficient for linear fits) to predict when lilacs might be in full bloom at a specific latitude.
- Construct a written argument based on data and evidence from Budburst about whether the prediction from a mathematical model should be used to set a date for a lilac festival.
Type of Analysis
- Graphing – Scatterplot
- Graphing – Histogram
- Mapping – Location Analysis
About this Citizen Science Project:
Budburst citizen scientists work together with research scientists, educators, and horticulturists to answer specific, timely, and critical ecological research questions by making careful observations of the timing of plant life cycle events, also called phenophases. These life events differ depending upon the type of plant, but usually include leafing, flowering, and fruiting phases of plants as well as leaf color and senescence.
Spring, summer, fall, and winter phases are all valuable. These observations are used to better understand how plant species and ecosystems respond to changes in climate locally, regionally, and nationally. Our projects and campaigns reflect the many ecological questions and issues raised by the ways humans impact the environment and how plants respond to those changes.
As a Budburst citizen scientist, you may invest as much or as little time as you like. You may observe and report on one or more plants over one season or over many years, or report on one plant observed for one day. All data contributions are valuable.
Budburst data are freely available for anyone to download and use and have been used by scientists, horticulturists, and educators in the Budburst network and beyond to address current research questions.”
Budburst is a project of the Chicago Botanic Garden.