Asking and Answering Questions with Data
About this Inquiry
This inquiry is intended to provide students with practice developing investigable questions that need data, and specifically large datasets, to be answered. In the inquiry students consider the types of data and visualizations that are needed to answer questions about water quality using a large dataset of water quality indicators in the Chesapeake Bay watershed. Students first study the relationship between dissolved oxygen, water temperature, and salinity. Then students investigate seasonal variations in dissolved oxygen based on these relationships. Finally, students use data to identify hypoxic zones in the watershed and what new questions they have about these sites. This inquiry is designed for high school students.
Instructional Days
2 days
Learning Goals
- Ask questions to determine quantitative and qualitative relationships between independent and dependent variables, using water quality indicators such as dissolved oxygen, water temperature, and salinity.
- Analyze data using tools and technologies to make valid scientific claims about seasonal shifts in water quality and potential effects on aquatic organisms.
Type of Analysis
- Graphing – Scatterplot
- Mapping – Filtering Data by Time
- Mapping – Spatial Analysis
About this Citizen Science Project:
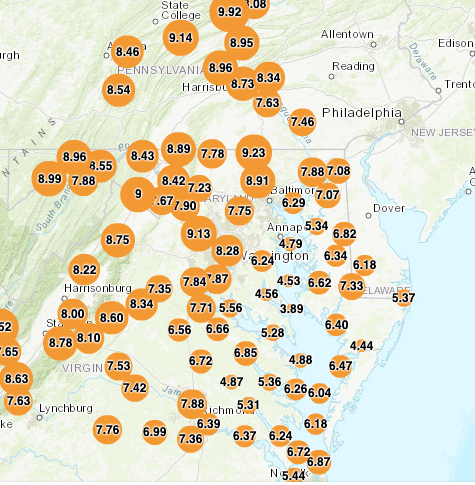
The Chesapeake Bay Watershed Project is a citizen science initiative in which community members and students investigate water quality issues on local and regional scales and collaborate across the Bay watershed to analyze data and take action. It is run in collaboration with the NOAA Chesapeake Bay Office. The project is open and free for students and educators across the Chesapeake Bay watershed to join. Classrooms can choose to collect and contribute data to this project or to analyze the existing data, including from other classrooms and citizen science groups around the watershed, as well as data from government agencies.
This dataset in FieldScope also includes governmental sources of water quality data from NOAA and the USGS.