Invitations to Inquiry with Data using FieldScope
Invitations to Inquiry are short instructional activities designed to help middle and high school students work with large data sets. The activities engage students with community and citizen science data from projects hosted on FieldScope. Teachers and students use the interactive FieldScope platform to collect, visualize, and analyze environmental data. With these new Inquiries, students can explore FieldScope’s advanced mapping and graphing tools to dig deeper into data in the context of meaningful science classroom lessons.
Each lesson engages students in interpreting graphs or maps, or both, and figuring out what the data means. Students will use data to answer questions like “What is the best time of year to host a lilac blossom festival?” Ultimately, the Inquiries are intended to increase student confidence in working with data and using visualization tools as part of the process.
These Inquiries are designed for 2-4 days of learning and support the Science and Engineering Practices from the Next Generation Science Standards. They include teacher guides, slides, handouts, and other instructional resources and supports. The activities work best with at least one computer for every 2-3 students along with high speed internet access.
Learn more about the design of the Invitations to Inquiry.
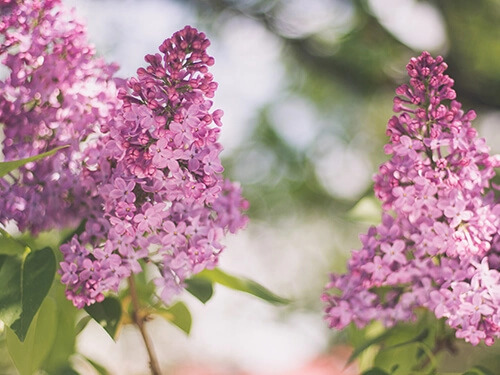
Budburst – Lilac Festival
Students use graphs and maps of lilac phenology data to determine the best time to host a lilac blossom festival in their area.

Chesapeake Bay Algal Blooms
Students use data from the Chesapeake Bay Watershed to determine what kind of land coverage is contributing the most to elevated levels of nitrates in the watershed which can lead to harmful algal blooms.
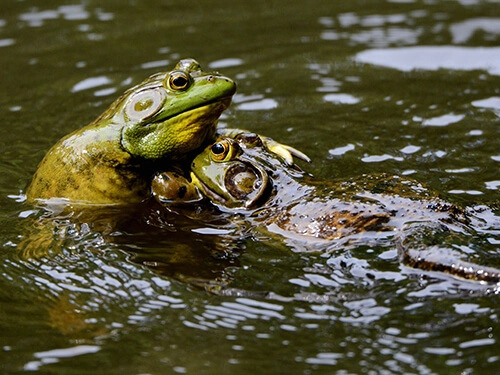
Frog Eat Frog World
Using maps and Frogwatch data, students explore the natural and invasive range of the American bullfrog.
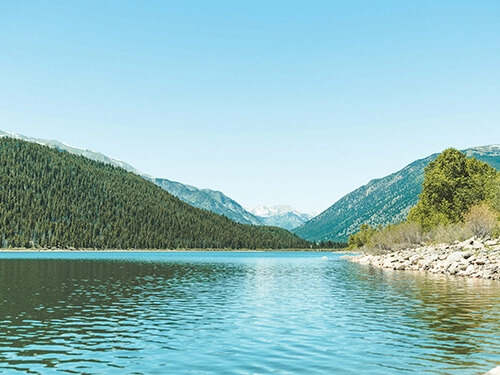
Heavy Metals in Waterways
Students investigate possible sources of heavy metal contamination using maps and data from Colorado.
This work is funded by a grant from the Pisces Foundation.